
|
www.riscos.com Technical Support: |
Text and graphics plotting is performed by the operating system. Many graphics operations require strings of control characters to be sent to the VDU drivers. However, BASIC provides keywords to perform some of the more common operations, such as plotting points, lines and circles and changing colours. This chapter describes those keywords.
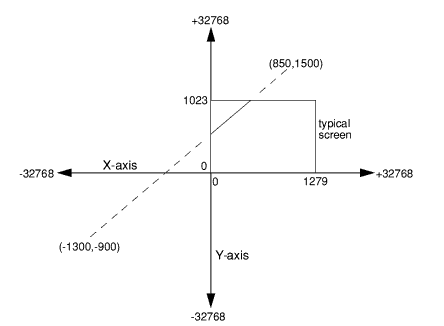
Whichever graphics mode your program is in, the actual range of coordinates that can be addressed is -32768 to +32767 in each direction. The coordinate range of the graphics screen that you actually use, and which is dependent upon the mode you select, is really a window on this area. Many graphics modes use a screen coordinate area 1280 units across by 1024 units high, with the origin (0,0) located initially at the bottom left corner of the screen. So, for example, you could draw a line between (-1300,-900) and (850,1500) and what would appear on the screen is the portion of the line which crosses the region (0,0) to (1279,1023):
Because the actual resolution of most of the modes available is less than the 1280 by 1024 system, screen pixels are more than one unit square. For example, in the 640 by 256 pixel mode 0, a pixel is 2 units wide (1280/640) by 4 units high (1024/256). However, because the same coordinates are used in every mode, a line drawn between, say, (100,100) and (768,564) will appear approximately the same. The only difference between the modes will be the apparent 'chunkiness' of the line, due to the different pixel sizes.
In most modes, the number of horizontal pixels is not a factor of 1280, and the number of vertical pixels is not a factor of 1024. Where such a mode has 25 text lines, there are 200 vertical pixels and the screen is 1000 units high. In the cases where there are 132 characters across, the vertical resolution is 1056 pixels. However, each pixel is still two units wide, so the screen is 2112 units wide. There are approximately 180 units per inch on most screens.
The simplest type of object you can plot on the screen is a single pixel, or point. To plot a point, you use the statement POINT followed by the x and y coordinates of the pixel you want plotted. For example:
POINT 640,512
will plot a pixel in the middle of the screen in the current graphics foreground colour (and tint in a 256-colour mode).
The program below plots random points within a radius of 200 units from the centre of the screen:
10 MODE 12
20 REPEAT
30 rad%=RND(199)
40 angle=RADRND(360)
50 GCOL rad%*8/200
60 POINT 640+rad%*COSangle, 512+rad%*SINangle
70 UNTIL FALSE
POINT may also be used as a function to discover the colour of a pixel. It has the form:
col = POINT(x%,y%)
In 256-colour modes it returns a number between 0 and 63. To find the tint of the pixel, you use the TINT keyword as a function in a similar way:
tint = TINT(x%,y%)
BASIC provides a very simple way of drawing lines on the screen. All you need to do is to work out the positions of the two ends of the line. You can then draw a line with a single instruction such as:
LINE 120,120, 840,920 : REM line (120,120) to (840,920)
You could draw the line the other way and produce the same result:
LINE 840,920, 120,120
The following program uses LINE four times to draw a box on the screen:
10 MODE 0
20 left% = 100
30 right% = 400
40 bottom% = 200
50 top% = 800
60:
70 LINE left%,bottom%, right%,bottom%
80 LINE left%,top%, right%,top%
90 LINE left%,bottom%, left%,top%
100 LINE right%,bottom%, right%,top%
The RECTANGLE statements provide an easier way of drawing boxes on the screen. The first two parameters of RECTANGLE are the x and y coordinates of the bottom left corner. The second two parameters are the width and height of the rectangle. For example:
RECTANGLE 440,412, 400,200
If the width and height are equal, as in a square, the fourth parameter may be omitted:
RECTANGLE 400,312,400
RECTANGLE FILL is used in exactly the same way as RECTANGLE, but instead of drawing the outline of a rectangle, it produces a solid rectangle. The following program plots solid squares of gradually decreasing size in different colours:
10 MODE 15
20 FOR I% = 63 TO 1 STEP -1
30 GCOL I%
40 RECTANGLE FILL 640-I%*8,512-I%*8,I%*16
50 NEXT I%
To draw the outline of a circle or to plot a solid circle, you need to provide the centre of the circle and the radius. For example:
CIRCLE 640,512, 100 : REM centre (640,512) radius 100
CIRCLE FILL 640,512, 50
This produces the outline of a circle centred at (640,512), which is the centre of the screen, and of radius 100. Inside this is a solid circle, again centred at (640,512), which has a radius of 50.
Try the following program:
10 MODE 15
20 REPEAT
30 GCOL RND (64):MOUSE x,y,z
40 CIRCLE FILL x,y, RND(400)+50
50 UNTIL FALSE
This program produces circles in random colours, centred on the current mouse position and with a radius of between 51 and 450. To stop it press Esc.
To draw the outline of an ellipse or to plot a solid ellipse you need to provide its centre point and the size of its major and minor axes. In addition, you may also give the angle by which it is rotated from the horizontal.
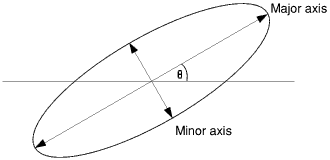
For example:
ELLIPSE 640,512, 200,100, PI/4
This produces the outline of an ellipse centred at (640,512). The length of it is 200, the width is 100 and it is rotated by pi/4 radians (45 degrees) from the horizontal. If you omit the angle, an axis-aligned ellipse is produced:
ELLIPSE 400,500, 320,80
Try the following program, which plots eight ellipses of two different sizes with the same centre point to form multi-petalled flowers:
10 MODE 1
20 GCOL 1
30 FOR angle = 0 TO 3*PI/4 STEP PI/4
40   ELLIPSE FILL 640,512,200,60,angle
50 NEXT angle
60 GCOL 2
70 FOR angle = PI/8 TO 3*PI/4+PI/8 STEP PI/4
80  ELLIPSE FILL 640,512,100,30,angle
90 NEXT angle
In previous examples, GCOL has taken one parameter, a number which selects the current logical colour for the graphics foreground or background. For example,
GCOL 3
GCOL 129
selects the graphics foreground colour to be logical colour three and the background colour to be one.
GCOL may, however, take two parameters: GCOL m,c. In this case the second (c) selects the foreground and background graphics colours, and the first (m) selects the manner in which c is applied to the screen as follows:
| m | Meaning |
|---|---|
| 0 | Store the colour c on the screen |
| 1 | OR the colour on the screen with c |
| 2 | AND the colour on the screen with c |
| 3 | EOR the colour on the screen with c |
| 4 | Invert (NOT) the colour on the screen (disregards c) |
| 5 | Leave the colour on the screen unchanged (disregards c) |
| 6 | AND the colour on the screen with NOT c |
| 7 | OR the colour on the screen with NOT c |
Two of the options ignore the second parameter and either leave the colour on the screen unchanged or invert it. Inverting a colour means that all the bits in the colour number are altered: zeros are set to ones and vice versa. For example:
10 MODE 9 : REM 16 colours 0(%0000) - 15 (%1111)
20 GCOL 128+5
30 CLG
40 GCOL 4,0 : REM plot in NOT (screen colour)
50 LINE 0,0, 100,100
The colour on the screen is colour 5 (%0101). The colour used to draw the line is, therefore, NOT (%0101) or colour 10 (%1010).
The OR, AND and EOR operators act on the bits of the colour already on the screen and on the colour given as the second GCOL parameter as described in the chapter Bases. Thus:
10 MODE 12 : REM 16 colours 0(%0000) - 15(%1111)
20 GCOL 128+5 : REM clear screen to magenta
30 CLG
40 GCOL 0,6 : LINE 0,0,     100,100
50 GCOL 1,6 : LINE 100,100, 200,200
60 GCOL 2,6 : LINE 200,200, 300,300
70 GCOL 3,6 : LINE 300,300, 400,400
80 GCOL 6,6 : LINE 400,400, 500,500
90 GCOL 7,6 : LINE 500,500, 600,600
The colour already on the screen when the lines are drawn is colour 5 (%0101). The foreground colour is selected as colour 6 (%0110) in all cases. The method of applying it to the screen, however, alters the actual colour displayed as follows:
In the examples shown so far, we have always explicitly mentioned where objects are to be plotted, for example by giving both end points of a line in the LINE statement. This isn't always necessary, because of the graphics cursor. The graphics cursor is an invisible point on the screen which affects where lines and other items are drawn from.
For example:
10 MODE 12
20 MOVE 100,100
30 DRAW 200,200
This moves the graphics cursor to (100,100), then draws a line to (200,200) and leaves the graphics cursor at this position. Now, if a further line is added to the program as follows:
40 DRAW 300,100
This adds a line from (200,200) to (300,100). BASIC's LINE command is actually shorthand for a MOVE followed by a DRAW.
Many of the graphics entities described in the next chapter rely on the current position of the graphics cursor, and some of them also use its previous positions.
All coordinates used so far are termed absolute because they tell the computer where to plot the object with respect to the graphics origin (0,0). However, it is also possible to use relative coordinates. When these are used, the coordinates given are added to the current graphics cursor position to find the new point. To use relative coordinates in POINT, MOVE and DRAW statements, you follow the keyword by the word BY.
Here is a program that starts in the middle of the screen and 'walks' randomly around:
10 MODE 0
20 MOVE 640,512
30 REPEAT
40 dx%=8*(RND(3)-2)
50 IF dx%=0 THEN dy%=8*(RND(3)-2) ELSE dy%=0
60 DRAW BY dx%,dy%
70 UNTIL FALSE
Printing text at the text cursor positions gives only limited control over the places at which characters may be located. In addition it does not allow characters to overlap. Attempting to print one character on top of an existing one deletes the existing one. You may find that you would like to be able to place text in different positions, for example to label the axes of a graph or to type two characters on top of each other, in order to add an accent, e.g. ^, to a letter. To do either of these type
VDU 5
You are now in VDU 5 mode. Whilst you are in this mode of operation, any characters you print are placed at the graphics cursor position. The text cursor is ignored. You can use the MOVE statement to locate the text precisely.
Since this method of printing makes use of graphics facilities, it is not possible in text-only modes. If the command VDU 5 is given in any of these screen modes it has no effect.
Each character is actually placed so that its top left corner is at the graphics cursor. After the character has been printed, the graphics cursor moves to the right by the width of one character. Although the graphics cursor also automatically moves down by the height of a character (32 units in modes 0 to 17) when the righthand side of the screen is reached, the screen does not scroll when a character is placed in the bottom righthand corner. Instead the cursor returns to the top left.
To return to the normal mode of operation type
VDU 4